Occupancy-Driven Cleaning · Building Service Contractors

Put Labor Where It Creates the Most Value.

Occupancy-Driven Cleaning gives BSCs a data-driven way to direct labor toward actual facility demand, reduce avoidable work, improve verified compliance, and convert better labor utilization into stronger contract economics.

16,141 hrs/yrLabor capacity recovered11% labor efficiency in the BSC ROI example
65% → 92%Verified service complianceIllustrative BSC ROI example
+4.8 ptsPotential margin improvement10.0% → 14.8% operating margin
+$483,465Potential annual profit improvementIllustrative $10M BSC example
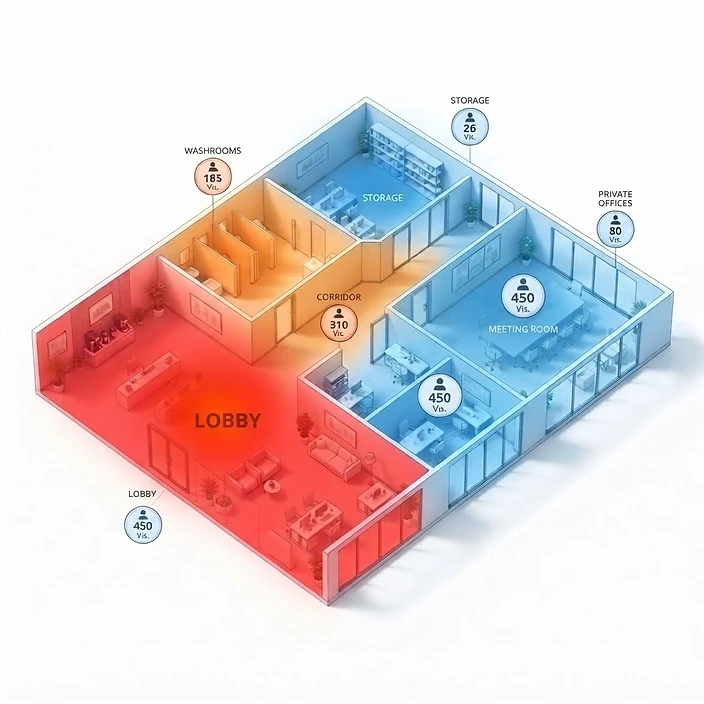
Floor plan heat map showing footfall intensity by zone
Occupancy-Driven Cleaning

Real occupancy replaces the fixed schedule.

Footfall counters measure real occupancy—how often a space is used, by how many people, and when. Instead of cleaning and servicing on a fixed schedule, teams deploy based on actual need: high-traffic areas get more frequent attention, low-use areas aren't over-serviced, and every visit is logged automatically. The result is lower operational waste, better compliance, and a defensible record of every service event.

How it works

Measure demand. Deploy labor. Prove the response.

Occupancy-driven workflows make facility demand visible so operations teams can direct labor more intelligently and measure the effect.

How Occupancy-Driven Cleaning worksOccupancy sensors or traffic counters measure real building use. Contactless FM applies thresholds and priorities, notifies the cleaning team, Proof of Presence verifies the response, and AI inspections can measure the result.1. Measure usageFoot traffic, occupancy,or space activity2. Prioritize needThresholds identifyhigh-value work3. Dispatch serviceNotify the right personat the right time4. Verify and improve• Proof of Presence verifies response• Service timing and duration recorded• Exceptions become visible• AI inspections can confirm qualityClean to the need.Not every space. Not every time.

Conceptual workflow. Exact occupancy technologies and service thresholds vary by contract.

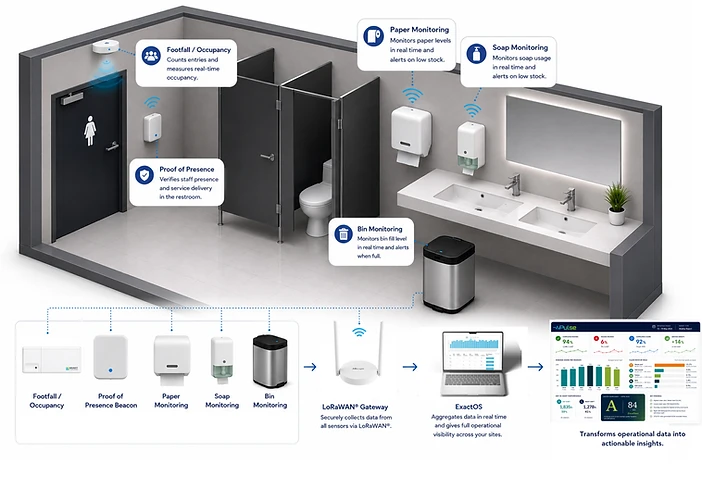
One Connected Smart Restroom diagram showing IoT sensors, LoRaWAN gateway, ExactOS aggregation, and W-Pulse dashboard
One connected smart restroom. Footfall/occupancy and Proof of Presence sensors capture real-time use and verified service, while paper, soap, and bin monitors alert on low stock and fill level. All sensors transmit through a LoRaWAN® gateway into ExactOS, which aggregates the data and surfaces it on the W-Pulse dashboard as completed rounds, compliance scores, and service density—turning operational data into actionable insight.
The BSC operating model

Use occupancy to recover productive capacity—not to chase a generic productivity claim.

The executive ROI model quantifies the opportunity through actual recovered hours, compliance improvement, margin expansion, and profit impact.

01

Recover Capacity

Reduce work that does not correspond to actual demand and move those labor hours toward high-priority service.

  • 16,141 modeled hours/year recovered
  • 11% labor efficiency in the example
  • Capacity expressed as hours, not a blanket percentage
02

Raise Verified Compliance

Pair occupancy-driven assignments with Proof of Presence so the contract can measure whether required service was delivered.

  • 65% current compliance
  • 92% projected compliance
  • +27 point improvement
03

Convert Operations to Margin

When wasted labor is reduced and service becomes more disciplined, the model shows how operational improvement can flow into financial performance.

  • +4.8 modeled margin points
  • 14.8% projected operating margin
  • +$483,465 annual profit improvement
Illustrative BSC executive results

Better labor utilization. Higher compliance. Stronger margin.

260 hrsSupervisor capacityModeled supervisor hours recovered annually.
14.8%Projected operating marginFrom a 10.0% baseline in the example.
+48.3%Increase in annual profitIllustrative profit increase in the executive report.
$483,465Potential annual profit improvementIllustrative $10M BSC example.

Illustrative ROI-calculator output, not a guarantee. Actual results depend on labor structure, occupancy patterns, contract scope, baseline compliance, and execution.

Quantify the labor and margin opportunity for your operation.

Use your own revenue, labor, compliance, and margin assumptions.

Generate Your BSC ROI Report →